Three takeaways from a deep dive into success rate in the College Draft
By Zach Carey | May 2, 2025
How do we measure success in the College Draft? Via a dive into professional lacrosse draft history over the last 25 years, we’ve analyzed draft success rate to break down the value of picks in each round and what expectations should be for each selection.
We chose two barometers for calculating a draft pick’s success.
The first is the “starter” threshold – players who played in over 70% of their team’s games over four years or across their career to date. These are players who are regular contributors and have sustained careers in professional lacrosse.
The second are the All-Stars (players who earned an All-Star selection). These are the difference-makers, the guys who impact winning in a significant way and are part of the foundation of their team’s success.
35.1% of all-time draftees have become starters. 26.5% have become All-Stars. Since the PLL’s advent in 2019, 51.8% of drafted players have become starters with 25.3% becoming All-Stars.
Here are a couple of initial observations from this exercise:
The top three picks are the pinnacle of the draft
Using the metrics above, the top three picks stand out as the best of the best. 95.8% of No. 1 overall selections have been All-Stars at some point in their career. Pat Spencer – who currently plays for the Golden State Warriors – is the only exception.
That 95.8% All-Star rate drops to 79.2% (19 of 24) for second overall picks and 83.3% (20 of 24) for third overall selections before plummeting to an average of 48.3% for picks No. 4 through No. 8.

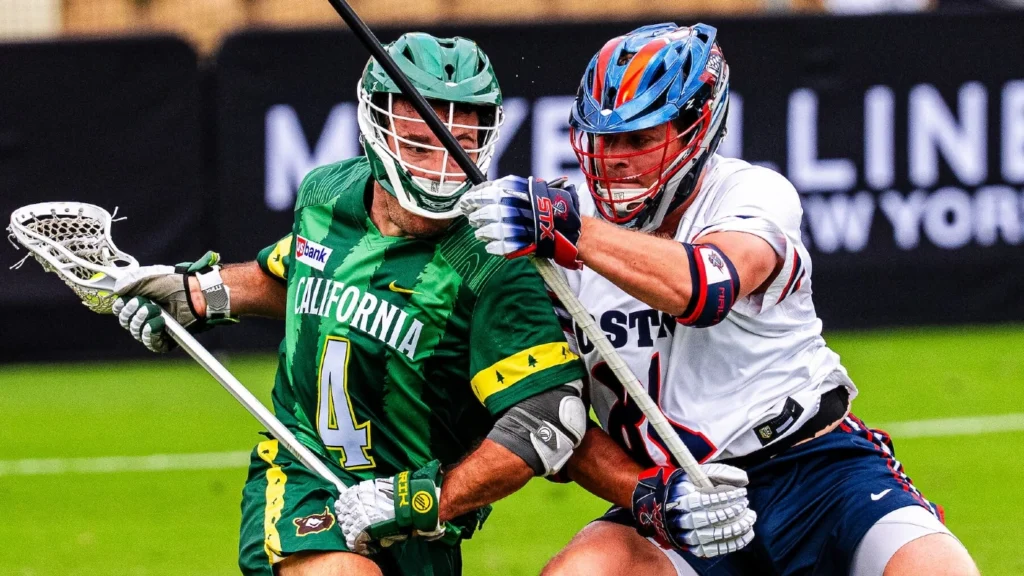
The California Redwoods currently hold the Nos. 2 and 3 selections in next week’s draft. In an average year, general manager Joe Spallina would have a 96% chance of landing one All-Star and a 66% chance at landing two All-Stars with those selections.
Round 1 is for offense
Drafting offensive players (and attackmen in particular) in the first round is the time to do it. 69.0% of attackmen drafted in the first round have become career starters. That number falls to 40.5% for attackmen in the second round. Meanwhile, 64.1% of defensemen drafted in the first have become starters and 59.5% of poles picked in the second round have become starters.

Attack is the premium position in lacrosse. Attackmen dominate touches at both the professional and college level. The guys who rack up massive point totals in college and lead their teams to success in May are the prospects PLL general managers want to build their teams around.
Good defenders may be slam dunks slightly less often in the first round. But, given the smaller delta between defenders taken in the first and second round than there is between first- and second-round attackmen, the data suggests that there are more solid defenders available in the later rounds.
Teams that want to add to their defense should take solace in the fact that, according to draft history, they’re nearly as likely to find a starter-caliber defender in the second round as they are in the first.
Teams should look to trade down more
First-round picks are incredibly valuable relative to the rest of the draft. Second-rounders are certainly a step below, but those still own nearly a 50% hit rate on starters whereas 31.6% of third-round selections and 31.8% fourth-round picks become starters.

These figures provide insight into how much each pick is worth. Using starting rate as the factor to determine a draft pick’s success, an average first-round pick is worth 1.41 second-round picks or 2.21 third-round picks. An average second-round pick is worth 1.57 third-round picks.
Trade-ups are rare in the College Draft, and these numbers provide some explanation for that. Finding sufficient value to justify losing a pick given the jumps in value between rounds is difficult.
The Philadelphia Waterdogs hold the ninth and 15th overall picks in this year’s draft. In an average draft, they’d expect a 24.4% chance of landing two starters with those selections and a 78.8% shot at drafting one starter.
In a hypothetical scenario where Philly wanted to package those picks to move up with a trade, they’d need to move all the way up to third overall to find a higher probability of drafting one starter (83.3%) than if they stayed at picks Nos. 9 and 15. They’d also lose any shot at drafting two starters by giving up a pick.
A team with two third-round picks has a 53.2% chance of picking one starter but only a 10% chance of picking two. Using that second pick to take a swing at moving up for a higher probability in the second round could provide value. Yet, to eclipse the 53.2% mark, said club would need to move up to a spot somewhere from pick No. 9 through No. 11 (59.7% become starters).
If anything, this data suggests teams should be more willing to trade down in the first two rounds. Whereas drafting seventh overall provides a 62.5% chance of picking a starter, moving back to No. 12 and picking up a third- or fourth-rounder results in a 63% chance of drafting one starter along with a 14.5% chance of landing two.
")