10 Man Ride: Expected Goals (xG) Model
CLEAR! The ride is on. The PLL Stats team is excited to roll out a new project: an Expected Goals (xG) model.
What is xG?
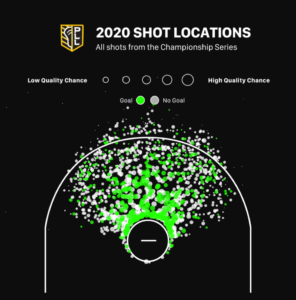
Common in free-flowing sports like soccer and hockey, xG is the statistical chance of a given shot becoming a goal. It’s a measure of shot quality that can be applied on a micro or macro level to analyze a player or team’s success relative to expectations.
Let’s run through the logic behind the model and the definitions of a few new phrases: xG, xSh. %, and Shooting Percentage Over Expectation (SPOE).
1. What factors determine a shot’s xG?
Opta’s soccer model was a huge influence for us. They consider distance, angle, body part (header or footer?), type of pass (through or cross?), and “big chance” – defined as “a situation where a player should reasonably be expected to score, usually in a one-on-one scenario or from very close range when the ball has a clear path to goal and there is low to moderate pressure on the shooter. Penalties are always considered big chances.”
Our model considers the following inputs when calculating the xG of a shot:
- Shot distance
- Shot angle
- Was there an assist prior to the shot?
- Was there a second assist prior to the assist?
- How much time is remaining on the shot clock?
- Where was the goalie on his arc?
- Our version of a “big chance” variable
All variables have been vetted for statistical significance. Here’s why we think they passed the test…
2. Shot distance
All else equal, an extra yard away from the cage costs you 1% off your expected shooting percentage.
This one is intuitive. Shooting percentage around the league drops steadily with distance from 5 yards-and-in (44.9%) to 5-to-10 yards (30.8%) to 10-to-15 yards (23.5%) to 15-to-20 yards (14.4%) to 20+ yards (11.8%).
Everything is relative. Midfielders shooting from range will have a lower expected shooting percentage than their attack peers. Offenses need those stretch shooters to space the field properly. And if those midfielders sink more shots than they “should,” defenses will send quicker help in the form of double teams or out-of-control approaches.

Distance alone does not determine shot quality. Some 8-yard shots are better than certain 3-yard bids. It’s one ingredient in our xG recipe.
3. Shot angle
Standing six feet tall and six feet wide, a lacrosse goal is 36 square feet. Depending on where you plant your feet though, you may only be looking at a fraction of those 36.
Visible shot angle is a strong predictor of a shot’s value. The best shooters can manipulate this measure, buying more angle by changing their release point.
Worth mentioning here: Whether or not a shooter’s stick is to the middle failed our significance test. My hunch is that the benefits of stick-to-the-middle shots are already baked into our other variables (specifically, assists). Natural side shots are assisted 52.8% of the time, while only 28.1% of wrong-sided shots are assisted.
(Either that or Ryder Garnsey’s impossible-angle, low-to-high snipe from the 2019 Championship is still juggling the algorithms. Our model gave this shot a 19.9% chance of finding twine.)
Jules Heningburg splits to the middle of the field, draws the defense in, and Matt Kavanagh finds Ryder Garnsey off the rebound.@PLLRedwoods @Julesheningburg @_mgk5 @rsgarnz pic.twitter.com/KtwFr4BpdT
— PLL Highlights (@PLLHighlight) February 12, 2021
4. Assists
Assisted shots have several benefits. Opposing goalies must track the pass and the shot. Their arcs may be compromised, and their reactions may be delayed. Assisted shooters are generally more open (why pass to a covered teammate?). A pass in a settled set increases the shooter’s angle by 22.3% on average.
5. Second assists
One pass is nice; “one more!” is even better.
Second assists are scarce. Only 8.7% of settled shots fit the bill. Fast breaks (20.4% of shots have a second assist associated with them) and powerplays (47.8%) facilitate ball movement.
6. Shot clock
As time dwindles, your chances of finding a better shot than the shot you currently have decline. Shooting percentage peaks early – from :52 to :41, league average shooting percentage is 32.1%. It drops slightly to 29.8% from :40 to :31. Then from :30 and on, shooting percentages plateaus around 25.3%.
Beware of causation here. As NBA analyst Seth Partnow has noted about the inverse relationship between the shot clock and shooting percentage in basketball, “It’s as likely that the shots are early because they are good/open as that they are good because they are early.”
Goodhart’s Law states that when a measure becomes a target, it ceases to be a good measure. Right now, the time remaining on the shot clock is a decent measure of shot quality; that doesn’t mean that teams should aim to maximize shot attempts simply because there is a lot of time remaining.
7. Goalie’s arc
Data suggests left-handed goalies are better against shots from one side of the field, while right-handed goalies stop more shots from the other side. More on that later when we roll out goalie heat maps.
8. “Big Chance”
This is the highest expected value of a shot (74.96%) in our database. It qualifies as a “big chance” -- and has several other factors working in its favor.
Notice the multiple passes, prime distance/angle, and the shot clock. This outlet by Tim Troutner allows the Woods to attack very early, and with fewer players on the field. Most fast breaks are 4-on-3s; this is a 3-on-2! Advantage: Offense.
Tim Troutner makes a clean save and outlets to Clarke Petterson who finds Ryder Garnsey for the goal.@PLLRedwoods @T_troutner15 @ClarkePetterson @rsgarnz pic.twitter.com/5nGMnN4tjt
— PLL Highlights (@PLLHighlight) January 28, 2021
9. 72.03 xSh. % … denied!
Here’s a fun new way to quantify big saves: Our model expects Simon Mathias to bury this 72.03% of the time. Not on Adam Ghitelman’s watch!
Chrome has numbers in transition, finds an attackman sneaking from X, but Adam Ghitelman makes a huge save from the doorstep.@PLLArchers @adam8taylor pic.twitter.com/iK8WymdIyJ
— PLL Highlights (@PLLHighlight) January 13, 2021
10. Shooting Percentage Over Expectation (SPOE)
That delta between shooting percentage and expected shooting percentage allows us to compare a player to the model. Essentially, how much better (or worse) is Player X shooting compared to what a league average player would make on the same shot selection?
Tom Schreiber’s 2020 SPOE was off the charts. Teams didn’t slide to him. He was forced to shoot off the dodge, on-the-run, from range. Our model expected him to shoot 20.7% during the Championship Series; he nearly doubled it at 38.7%.
Eight-and-in club member Eric Law lurks around the crease. His expected shooting percentage was 40.0% in 2019 – high for a full summer – and he still exceeded it, shooting 54.8%.
Some players our model was really close on: Romar Dennis in 2019 (13.8 sh. %, 13.3 xSh. %), Jake Froccaro in 2019 (22.9 sh. %, 22.5 xSh. %), Curtis Dickson in 2020 (29.3 sh. %, 29.1 xSh. %), Wes Berg in 2019 (37.5 sh. %, 37.6 xSh. %), Ryan Brown in 2019 (25.8 sh. %, 26.0 xSh. %), and Drew Snider in 2019 (25.0 sh. %, 25.2 xSh. %).
Completion Percentage Over Expectation (CPOE) is one of the best indicators of a college quarterback’s success in the NFL. It’ll be interesting to see whether a player’s SPOE can predict future performance in lacrosse or if some players will regress back toward their expected shooting percentage.
Thanks for reading!
Spread the word, submit any questions you want to see answered in this space to me on Twitter (@joekeegs), and I’ll talk to you next week!


Pingback: exchange bulut mail
Pingback: Torch Search Engine Onion Address
Pingback: lenovo sunucu destek
Pingback: Buy Marijuana wholesale
Pingback: Glo Extracts YUMBOLDT
Pingback: Plymouth workers call in sick more than any other UK city
Pingback: Replica rolex swiss imitations watches
Pingback: ถาดกระดาษ
Pingback: buy cz guns USA online
Pingback: read what he said
Pingback: สล็อตวอเลท
Pingback: sbo
Pingback: apps mods
Pingback: buy cc dumps
Pingback: sbo
Pingback: sbo
Pingback: dispensary near me
Pingback: LSM99
Pingback: 웹툰 다시보기
Pingback: bonanza178
Pingback: Bassetti Bettwäsche Angebote
Pingback: jazz
Pingback: ตกแต่งภายในหาดใหญ่
Pingback: calming music